How Necessary are Electrolytes?

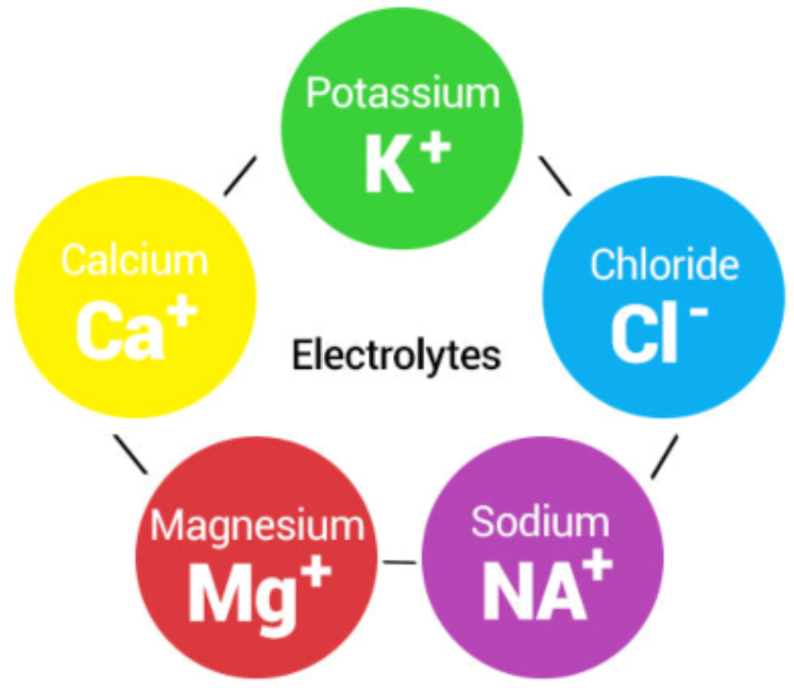
Electrolytes are minerals—like sodium, potassium, magnesium, calcium, chloride, and phosphate—that carry an electric charge when dissolved in bodily fluids.

These charged particles are critical to maintaining fluid balance, enabling nerve signals, and powering muscle contractions, including the heart itself.

Why We Need Electrolytes

Think of electrolytes as traffic signals for your body’s communication network. Without enough signals, nerve impulses stall, muscles falter, and blood flow gets stuck—leading to dehydration despite drinking plenty of fluids.

Electrolytes are absolutely essential for normal function of nerves and muscles,” says Dr. Lawrence Armstrong, professor emeritus of physiology at the University of Connecticut. “Without them, we simply couldn’t move, think, or keep our hearts beating.”

The American College of Sports Medicine, echoed by experts like dietitian Holley Samuel, RD, sums it up: losing sweat means losing sodium and other minerals. If you only drink plain water, it doesn’t absorb well—your body drains it quickly, making you dehydrated all over again.

However, for most everyday activities, our balanced diets supply enough electrolytes: bananas for potassium, dairy or leafy greens for calcium, nuts and seeds for magnesium, salty foods for sodium.

“For the vast majority of people, water and a balanced diet are more than adequate to maintain electrolyte balance,” says Dr. Benjamin Levine, professor of medicine and cardiology at UT Southwestern. “Sports drinks are heavily marketed but often unnecessary outside of prolonged, intense exercise.”

In short, electrolytes are essential, but sports drinks and powders are often unnecessary unless your body is working really hard or sweating profusely.

How Much Do We Actually Need?

Let’s get specific. For general health, the standard Dietary Reference Intakes recommends:

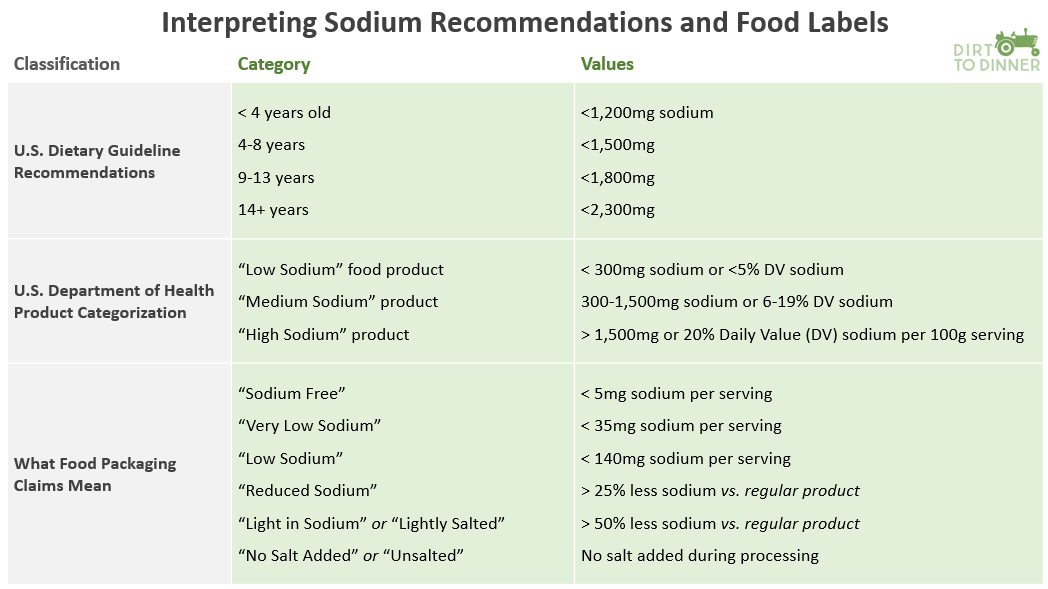
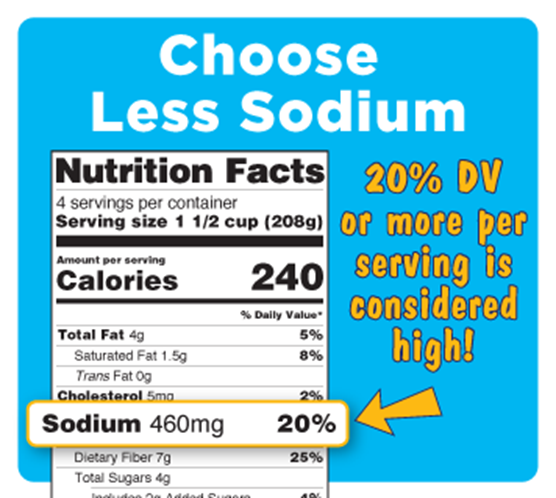
  • Sodium: Up to 2,300 mg per day (but average diets often exceed this)
    • Careful with sodium! 2 slices of pepperoni pizza = ~2,300 mg
  • Potassium: ~2,600–3,400 mg daily
    • 1 banana + 1 baked potato + 1 cup spinach = ~2,200 mg 
  • Calcium: ~1,000 mg daily
    • 1 cup milk + 1 yogurt + 1 oz cheese = ~800 mg
  • Magnesium: 310–420 mg per day
    • 1 oz almonds + 1 cup beans + 1 cup spinach = ~350–400 mg

For athletes, needs differ. One study notes pre-training hydration should include ~500–600 mL of water or sports beverage 2–3 hours before activity, plus another ~200–300 mL shortly before. During exercise, aim to limit body weight loss to under 2% by matching fluid (and electrolyte) losses.

In endurance sports, sodium loss can skyrocket with intensity.

For example, experts note sodium loss increased by 150% as intensity ramped up in a 2019 cycling study. Sports dietitian Kala Reister recommends 300–600 mg of sodium per hour for intense, hot, or prolonged workouts.

Particularly in hot or prolonged events, these athletes benefit from electrolyte-carbohydrate mixes. A review of hydration science underscores the dual risk of dehydration and overhydration during long-duration workouts—and the pivotal role of fluids with electrolytes.

Personalization is key, too. “Athletes vary dramatically in how much sodium they lose, anywhere from 200 milligrams to over 1,000 milligrams per liter of sweat,” explains Dr. Douglas Casa, CEO of the Korey Stringer Institute at UConn. “That’s why personalized hydration plans are so critical.”

A randomized trial found that hydration plans tailored to sweat rate and sodium loss improved anaerobic performance, cognitive focus, and heart rate recovery—compared to ad lib hydration.

Maltodextrin: The Carby Sidekick

Maltodextrin is a starch-derived carbohydrate, easily dissolved and rapidly converted to glucose, earning a place in everything from baked goods to energy gels. It has a high glycemic index—meaning it spikes blood sugar quickly.

In sports drinks, maltodextrin provides an energy boost. This quick source of fuel is particularly useful in endurance contexts. Maltodextrin also helps improve hydration. In carbohydrate–electrolyte solutions (like Gatorade), maltodextrin enhances water absorption in the gut.

Think of maltodextrin as the “courier” in a postal system—it helps deliver water and electrolytes from your digestive tract into your bloodstream, just like a driver delivering packages to your house. Without the courier, deliveries (hydration) happen, but slower and less reliably.

A study of maltodextrin–fructose beverages showed improved exogenous carbohydrate oxidation and fluid delivery during sustained moderate-intensity exercise, suggesting better fuel and fluid absorption compared to other options.

“Carbohydrate–electrolyte drinks, especially those with maltodextrin, can improve fluid absorption and endurance performance,” notes Dr. Asker Jeukendrup, a leading researcher on sports nutrition. “But they are tools for athletes, not everyday consumers.”

It is important to note that outside of immediate athletic use, maltodextrin is processed by the body just like sugar. It doesn’t always show up under “sugars” on a nutrition label, but it still acts like one in your bloodstream—causing sharp glucose spikes. For those not actively burning through energy (such as endurance athletes mid-race), frequent consumption can contribute to the same metabolic concerns as eating sugary foods.

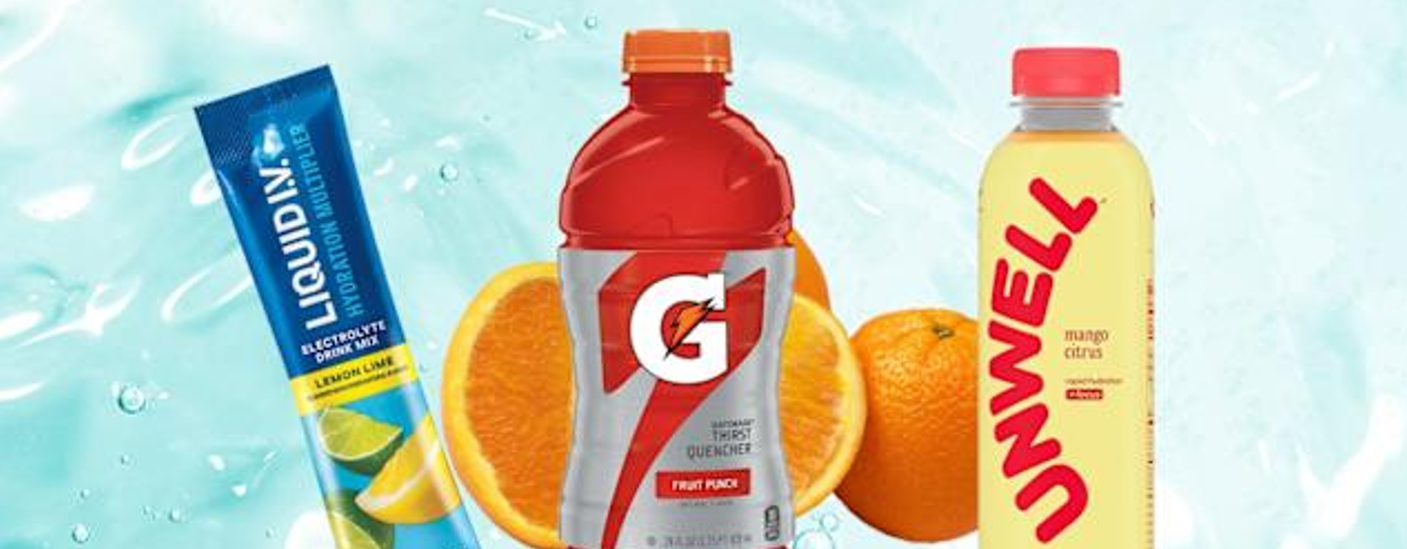
Marketing vs. Reality—What Consumers Should Know

Electrolyte products have flooded the market with packets promising “instant hydration,” bottles touting exotic mineral blends, “hangover cures,” and more. A SELF article reminds us: electrolyte drinks help rehydrate faster than water alone, but overuse can lead to fluid retention or high blood pressure.

Nor are electrolyte supplements a cure-all. Stanford researchers found they didn’t prevent illness in endurance runners—especially in hot weather—highlighting that factors like overhydration and long training loads were more relevant. And the British Medical Journal emphasizes that non-elite athletes often don’t need sports drinks—and that overconsumption may even be harmful due to sugar and electrolyte excess.

“Overuse of electrolyte supplements can lead to imbalances just as much as underuse,” warns Dr. Tamara Hew-Butler, associate professor of exercise science at Oakland University. “Hyponatremia—dangerously low sodium—can actually result from drinking too much fluid, even if it contains electrolytes.”

Electrolyte supplements are popular even beyond athletics, but most people meet needs via food and water; supplements help in intense activity or fluid loss scenarios—but excess can be harmful, especially for salt-sensitive individuals.

Practical Takeaways for Readers

  • Casual exercise, daily hydration: Water plus a balanced diet is enough.
  • Long, intense, or hot workouts (>1–2 hrs): Use an electrolyte–carbohydrate drink—or at least ingest something with sodium and drink some water. A good starting point is 300–600 mg sodium per hour.
  • Illness with vomiting/diarrhea: Rehydration solutions (like Pedialyte or maltodextrin–electrolyte mixes) are appropriate.
  • Personalized hydration: Measure your sweat rate and sodium loss to tailor fluids to your body’s needs. Sweating through multiple shirts? Dripping at the end of a cardio workout—this may translate into excess water loss and thus a need for higher electrolyte intake.
  • Risks or restrictions: If you have hypertension, kidney issues, or dietary sodium restrictions, consult a healthcare provider before adding electrolyte products.

Electrolytes are non-negotiable for nerve, muscle, and fluid balance, but for most people, everyday diets provide all that’s needed for regular hydration. Supplements and sports drinks can be helpful in specific situations—such as for endurance athletes, excessive sweating, body fluid loss, or during intense activity in hot climates—but they are rarely necessary otherwise.

Research consistently shows that personalized hydration plans, tailored to individual sweat rate and sodium loss, work better than one-size-fits-all guidelines. And while electrolytes are essential, more isn’t always better: overconsumption of sports drinks adds excess sugar and may harm cardiometabolic health.

Rising beer prices: How will consumers react?

Tariffs are creating an enormously complex and challenging market scenario for foreign companies, importers and domestic consumers alike – with an anticipated bottom line of higher costs.

To illustrate the complexity of today’s tariff scenario, we’re turning to one of our favorite beverages as an example of how a seemingly simple product can pose global pricing challenges. It’s important to note that until each country completes its negotiation with the Trump Administration, we can’t be sure of its effects on pricing and trade. But here’s where negotiations stand as of today.

U.S. Demand for Imported Beer 

Pity the poor American beer drinker.  At least, pity anyone who likes beer from countries outside the United States. Tariffs are an economically significant development for everyone from the barley grower in the American heartland to cookout enthusiasts at the backyard barbeque.

Beer imports have been a fast-growing segment of the beverage industry, with the U.S. market reaching as much as $11 billion in 2024. This was driven by robust U.S demand for popular brands from Mexico (Modelo, Dos Equis and Corona) and the European Union (Heineken, Stella Artois and Guinness). Canada also joins the list with robust sales of such beers as Labatt’s and Molson.

Since June 2023, Mexico’s Modelo Especial has surpassed Bud Light as the best-selling beer in the United States.

Corona Extra, Negra Modelo, Dos Equis and Corona Light all had a place in the top 20 list.

Modelo’s share of the imported beer market now exceeds 30 percent, with Corona at roughly 17 percent, Heineken at 15 percent and Guinness at roughly 12 percent. The roster of best-selling beers in the United States shows the dominance of Mexican beer brands:

Brewing Tariff Concerns

But anticipated growth for this segment is in flux.

The imported beer industry has been caught in the middle of global trade disputes. New tariffs are hitting Mexico, Canada, and the EU, and the impact depends on which way the beer is flowing.

Here are some of the ways countries are currently getting hit with beer tariffs:

United States Tariffs

  • 50% tariff on aluminum cans (applies to all imported canned beer, including from Canada and Mexico)

  • Additional country-specific tariffs apply to beer itself

  • 10% tariff on most alcoholic beverages from countries not covered by other executive actions

Mexico’s Tariffs

For U.S. imports:

  • Delayed response at first to U.S. tariffs

  • As of August 2025, 25% tariff on many Mexican goods entering the U.S.

  • Ongoing U.S.-Mexico trade talks, with a potential deal by November 2025

For EU imports:

  • EU-Mexico Global Agreement eliminates tariffs on food and drinks, including beer

  • 25% U.S. tariff applies to Mexican goods going to the U.S., but not to beer sent to the EU

Canada’s Tariffs

For U.S. imports:

  • Canada imposed 25% retaliatory tariffs on U.S. beer, wine, and spirits in early 2025

  • Retaliation followed U.S. 25% tariffs on Canadian goods outside of USMCA coverage

For EU imports:

  • U.S.-EU trade deal (July 2025) set a 15% import tax on most EU goods, affecting Canadian beer exports to the EU

  • EU counter-tariffs on some U.S. goods, but alcoholic beverages excluded

Europe’s Tariffs

For U.S. imports:

  • EU imposed 15% tariffs on most U.S. goods in response to U.S. trade actions

  • Announced additional retaliatory tariffs in March 2025 on U.S. beer, bourbon, and other products

Production Costs & Tariffs

Recent tariff increases have muddied the picture for beer imports, however. The Trump Administration in April announced an overall tariff of 25 percent on beer imports, followed on the July 4 “Liberation Day” with an additional 10 percent tariff.

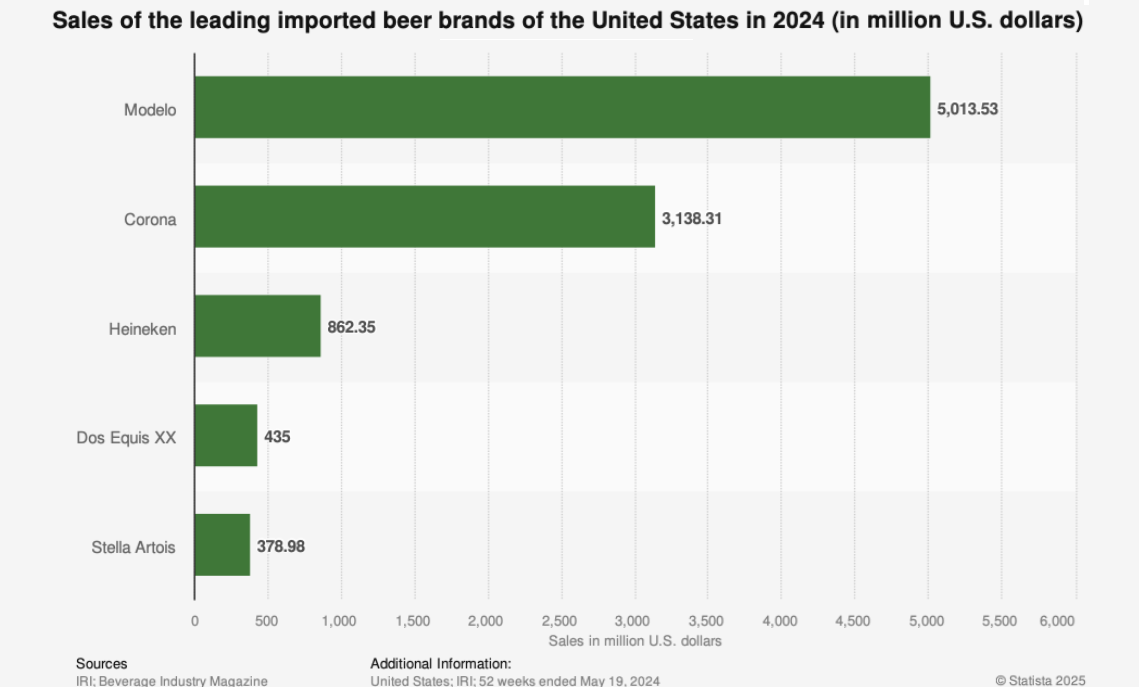
Perhaps of surprise to many consumers, tariffs on imports of aluminum play an important role in the potential price run-up for beer drinkers and other consumers.

The beverage industry paid $1.7 billion for 8 million metric tons of aluminum between March 23, 2018 and August 31, 2022, according to a study by the Beer Institute, an industry trade group. Industry experts contend the aluminum tariffs add as much as 5 cents per can to the price of beer.

The barley sector also has a stake in the imposition of tariffs. While Canada grows its own barley, it is still the largest importer of U.S. barley, with Mexico being the third largest. (The EU relies largely on its own production of barley for brewing and animal feeds, importing roughly a half-billion dollars of barley per year).

Reciprocal tariffs imposed by countries that do import substantial amounts of U.S. barley could further compromise valuable export markets at a time of serious financial difficulties facing American farmers. In March, Canada imposed a 25 percent tariff on barley and other products, but has announced plans to scrap the counter-tariffs except for autos, steel and aluminum.

Revisiting the USMCA Agreement

Trump’s Administration seems intent on unwinding some of the trade tension by going back to the tariff schedules agreed in the 2020 United States-Mexico-Canada (USMCA) trade agreement. But the shifting tariff terms create uncertainty and worry across many economic sectors, including the U.S. farm community. The U.S. brewing industry shares these concerns.

Most larger brewers rely upon supply contracts, and the USMCA offers protection and hope for preservation of both Mexico and Canada barley markets. But smaller brewers face a tougher situation.

According to Bart Watson, president and CEO of the Brewers Association, as quoted by MSN:

“We have a fairly integrated North American barley and malt system. Because most U.S. barley is contracted by large brewers or for export to Mexico, a lot of craft brewers end up getting malt from Canada.

…Overnight, tariffs could add $60 million, give or take a little bit, to the cost structure of small brewers in the U.S.”

– Bart Watson, President & CEO of Brewers Association

This has led some brewers to start looking at other avenues for malt or to increase some European orders, which could also be impacted, based on threats from the administration.

The full effects of the complex tariff picture have yet to become fully apparent, as brewers, importers and retailers wrangle with how much of the added costs can be passed along to consumers already frustrated by rising food and beverage prices.

Higher transportation costs, energy prices and other costs of doing business add to the squeeze. Most industry figures agree the still-robust beer sector faces an uncertain consumer response to inevitably higher costs for imported beer.

Shift to Domestic Demand

The tariffs, along with rising health concerns and consumer budget pressures, have led to demand trends that worry beverage industry leaders.

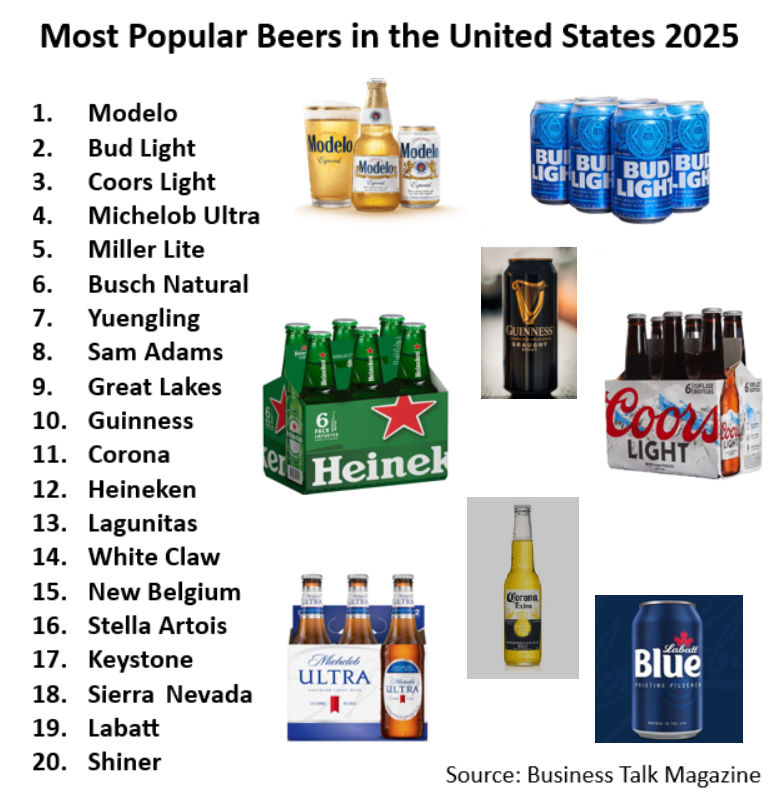
Two of the most significant suppliers of imported beer – Canada, and even more so Mexico – enjoy a special exemption from the brunt of the tariff costs because of pre-existing trade agreements with the United States.

As valuable as this exemption may be, it doesn’t completely free them from price pressures.

Analysts cited by birrup.com forecast that “the traditionally affordable imported beers may become luxury items, forcing consumers in price-sensitive segments to reconsider their preferences.

In response, there is anticipation of shelf space redistribution favoring either domestic beers or tariff-exempt contract-brewed alternatives, potentially altering the competitive landscape in the near term.”

Domestic beer producers would seem to have a potential advantage in the existing market picture. However, industry observers point to a tough market ahead with consumers shifting to non-alcoholic drinks and other ‘lighter’ alcohol choices. Even the popular craft beer industry has seen a drop in sales.

As summarized by toasttab.com, a restaurant point-of-sale service:

Beer prices are shaped by a combination of supply-side pressures—like rising ingredient, packaging, and transportation costs—and shifting consumer demand.

According to the NBWA Beer Purchasers’ Index (BPI), nearly every major beer category is experiencing a decline in demand, signaling a more cautious and competitive environment for bars and distributors.

Premium domestic beers are expected to fare comparatively well, especially as consumers compare prices for these brands against the most popular foreign brands.  Light beers and ‘premium’ domestic beer brands (such as Michelob Ultra), however, potentially face increasingly price-sensitive consumers as well.

The picture for imported beer demand also is pessimistic. According to Toasttab.com:

Imported beers experienced the sharpest drop across all segments in 2025. The BPI for this category fell from 67 in March 2024 to 46 in March 2025, marking its first time in contraction territory since April 2020. That’s a 21-point decline—reflecting a significant pullback in distributor purchasing.

Despite falling demand, prices for imports like Heineken and Modelo are likely to remain elevated. International shipping costs, tariffs, and fluctuating currency rates continue to drive up the base cost, limiting how much retailers and bars can discount without eroding margins.

Prices in the Cooler

A completely unscientific survey of beer prices at a range of beverage retailers tells the story in stark dollars and cents. While the price for each beer may vary from area to area, the price disparity between domestic and imported beers seems clear.

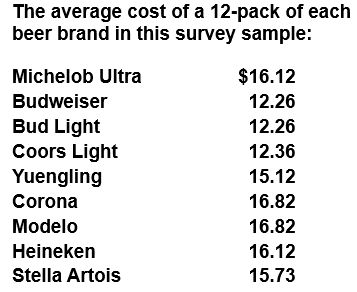
In this sample, the disparity between domestic and imported averaged roughly $3 per 12-pack at $2.96.

The gap between imported beers and premium brand domestic beers was much smaller, but the disparity with the most popular standard domestic brands (Budweiser, e.g.) was closer to $4.50.

As birrup.com noted above, beer brewers and marketers are carefully watching the beer market to see how the shifting economics and prices affect consumer behaviors.

Will they pay the higher costs for premium brands – imported or domestic or shift their buying habits toward lower price non-premium brands?

Can We ‘Make America’s Children Healthy Again’?

The Trump Administration’s Make America Healthy Again (MAHA) report came out on September 9th to address the plight of America’s children’s health.

The report was specifically tasked with investigating the root causes of childhood chronic diseases and providing a blueprint for a healthier future. Robert F. Kennedy, Jr. led a collaborative undertaking to guide this initiative to solve the severe health crisis in America.

MAHA points out the alarming numbers:

  • 60% of Americans have at least one chronic disease,
  • 25% of children suffer from allergies,
  • 20% of children over 5 years are obese, and
  • 40% of the entire population is either diabetic or prediabetic.

In 2023, U.S. health spending grew 4.4%, significantly outpacing a 2.5% growth in GDP. The surprising twist is that Americans still live shorter lives than people in other wealthy countries, despite pouring more money into the healthcare system.

What are the causes?

The MAHA report indicated four significant drivers for these diseases:

The food American children are eating. 

While the food is safe, it could be healthier by avoiding ultra-processed foods high in added sugars, chemical additives and saturated fats. Moreover, the food doesn’t contain essential micronutrients and dietary fibers.

The report takes a closer look at 70% of branded food products that are ultra-processed. The result of eating too much is a lack of nutrients, increases type 2 diabetes, increased obesity, and potential for inflammation.

American children’s exposure to environmental chemicals. 

Over 40,000 chemicals are registered for use which include pesticides, microplastics, and dioxins are found in the blood and urine of children and pregnant women.

American children’s pervasive technology use. 

Children have gone from active play-based childhood to a sedentary, technology driven lifestyle. The result of inactivity and social media is sadness and hopelessness, little friendships, and depression.

American children are highly medicated. 

It is not working. This is often driven by conflicts of interest in medical research, regulation, and practice.

What’s the solution to Make American Children Healthy Again?

The solution to these issues is to advance critical research, realign incentives and systems to drive health outcomes, including policy reforms, deregulation, and agency restructuring.  It also stresses an increase of public awareness through education campaigns and public-private sector collaboration.

This initiative was not just led by RFK, Jr. It has the footprint of four others in the Trump Administration:

Brooke L. Rollins, U.S. Secretary of Agriculture

  • Champions voluntary industry commitments; provides technical assistance for SNAP reform; focuses on strengthening the American food supply.

Lee Zeldin, EPA Administrator

  • Leads efforts to address environmental exposures like banned pesticides; frames the commission’s work as a family-focused initiative.

Dr. Jay Bhattacharya, NIH Director

  • Views the MAHA Report as a government-wide blueprint; advocates for new, gold-standard scientific research to address chronic disease.

Dr. Marty Makary, FDA Commissioner

  • Believes health care has been “reactive” to chronic disease; provides a nuanced perspective on ultra-processed foods and specific ingredients.

The attention and awareness of the relationship between diet, sleep, exercise, and health is the key to longevity, not to mention going from a healthy childhood to a healthy adulthood.

Stay tuned as Dirt to Dinner releases more information on the key concerns highlighted in this report. We’ll also provide information and insights to improve our health and wellness in these key areas.

Sodium vs. Salt: What’s the Difference?

The CDC estimates that nearly 90% of U.S. adults consume too much sodium, and excess intake is directly linked to elevated blood pressure—the single largest preventable risk factor for heart disease and stroke.

What’s tricky about sodium is that consuming too much at once doesn’t make you feel bad right away. Unlike sugar, which can cause an energy crash, or caffeine, which you feel within minutes, sodium’s effects build silently over time. That’s why it’s often called a “stealth health risk.”

Sodium ≠ Salt…and why that matters

Sodium is a single element – a mineral, to be exact. Salt is a compound of two elements: 40% sodium and 60% chloride, and is commonly consumed as “table salt”.

We need sodium – just not too much. Sodium, along with chloride, is an electrolyte that carries an electric charge when dissolved in our blood. They regulate the water in and around our cells.

Along with other electrolytes, sodium and chloride create the electrical signals that allow our muscles and nerves to communicate. Salt is also critical for making stomach acid, which we need for digestion. Ultimately, it facilitates the transport of nutrients and waste across cell membranes.

But too much sodium can lead to high blood pressure, water retention, higher blood volume, and then higher blood pressure. So how much is too much, and how much is just right?

U.S. Dietary Guidelines state that the recommendation is <2,300 mg/day of sodium for adults and teens. This is roughly the amount of sodium in a teaspoon of table salt.

The American Heart Association’s goal is 1,500 mg/day, especially for people with high blood pressure. This amount is just enough salt to cover the face of a quarter. And here’s a motivating nudge: for most people, cutting back by just 1,000 mg can improve blood pressure and heart health by 10%, according to the American Heart Association.

Even with these recommendations, the average intake remains too high at 3,300–3,400 mg/day.

So what can we do—what should we avoid, or look for?

Where sodium really comes from

Most of the sodium Americans eat doesn’t come from the salt shaker—it’s hiding in everyday foods.

More than 70% of our sodium comes from packaged and restaurant foods.

Top contributors include breads and tortillas, sandwiches and deli meats, soups, sauces, pizza, grain dishes, cheeses, and savory snacks.

Myth vs. Fact: Salt Edition

Myth: Sea salt is healthier than table salt.

  • Fact: Both contain ~40% sodium by weight. The only difference is texture and trace minerals.

Myth: If I don’t add salt, my diet is low in sodium.

  • Fact: Over 70% of sodium comes from packaged and restaurant foods—not the salt shaker.

Myth: I’ll feel it if I’m getting too much sodium.

  • Fact: High sodium has no immediate “symptoms,” which is why it’s called a silent risk factor.

Research on sodium and health

Across dozens of studies, lowering sodium reduces blood pressure, regardless of your starting point.

A large meta-analysis found consistent, dose-responsive reductions in systolic blood pressure (BP) when people reduced sodium. In controlled feeding studies (DASH-Sodium), pairing a produce-rich pattern with lower sodium led to stepwise BP drops, with the largest reductions at the lowest sodium level. Lower blood pressure translates to fewer cardiovascular events across populations.

Foods rich in potassium—beans, potatoes, leafy greens, dairy, seafood, and fruits—help the body excrete sodium and relax blood vessels. The World Health Organization recommends ≥3,510 mg/day of potassium for adults, and trials show higher potassium intake reduces BP (especially when sodium is high!).

A powerful combo in the real world, in the SSaSS trial (600 villages, ~21,000 people), replacing regular salt with a potassium-enriched salt lowered stroke, major cardiovascular events, and death. By lowering sodium consumption while adding potassium-rich foods into your everyday meals, you can meaningfully reduce its ill effects.

“This study provides clear evidence about an intervention that could be taken up very quickly at very low cost.”

Dr. Bruce Neal, MD, SSaSS trial

The World Health Organization has identified sodium reduction as one of the most cost-effective public health interventions worldwide. Excess sodium contributes to an estimated 1.9 million deaths annually from cardiovascular disease.

Some countries, such as the UK, have successfully reduced sodium intake at a population level through reformulation targets and public awareness, demonstrating that collective shifts in the food supply can drive significant health benefits.

However, there’s a word of caution to reducing sodium intake among rigorously-training athletes. Endurance efforts in the heat can result in significant salt losses through sweat. Sports-medicine guidance favors personalized fluid and electrolyte plans based on sweat rate, duration, and conditions. For long, hot sessions, include sodium (sports drinks or salty foods); avoid both dehydration and over-hydration with plain water.

Sodium-reduction tactics that work

Cutting back on sodium doesn’t have to mean bland food. The trick is to build layers of flavor so you naturally reach for less salt. Start by leaning on umami—that deep, savory taste found in mushrooms, tomatoes, Parmesan, soy sauce, and other fermented foods.

One lesser-known tool in the umami toolbox is monosodium glutamate (MSG). Despite its controversial reputation, the FDA classifies MSG as Generally Recognized As Safe (GRAS), and controlled studies haven’t consistently shown harmful effects. When mild reactions do occur, they’re linked to very large doses eaten without food. MSG is also far lower in sodium: about 12% sodium compared with table salt’s ~39%. That means swapping some salt for MSG in soups, stews, or stir-fries can trim total sodium by 30–40% while keeping food satisfying.

Flavor boosters don’t stop there. Add acids and aromatics—citrus, vinegars, fresh herbs, garlic, spices, and chiles—to brighten and deepen flavor. Use techniques like toasting spices or browning meat and vegetables to create natural complexity.

Pantry strategies help, too. Draining and rinsing canned beans removes up to 36–41% of their sodium. Choosing “no-salt-added” versions gives you even more control, letting you season back with herbs, acids, and just a light sprinkle of salt.

And don’t be fooled by fancy salts—sea, Himalayan, or flaky crystals. They don’t provide health advantages over iodized table salt. By weight, sodium is sodium; coarse crystals just look like less because fewer fit in a teaspoon.

If your household avoids dairy or seafood, or typically uses non-iodized salts, keep iodized salt in rotation. Iodine is essential for thyroid health, and many specialty salts don’t supply it.

As for outside of the household, the FDA’s voluntary sodium reduction goals for food makers aim to bring down sodium across popular categories like soups, breads and sauces, nudging the whole food supply in a healthier direction while keeping taste. That helps you succeed without micromanaging every meal.

For your next meal or grocery run, focus on where sodium really hides (packaged and restaurant foods), use label-reading as your secret weapon, and lean on flavor-building techniques like herbs, acids, and umami-rich foods. Pair sodium reduction with more potassium-rich foods, and you’ll tackle blood pressure from both sides of the equation. Small, steady changes can protect your heart for decades to come.