Avian Flu Drives Soaring Egg Prices

Let’s set the stage with a scene from a modern marriage:

Me:  Honey, your birthday is next week, and it’s a big one.  Let’s do something really, really special to celebrate.

My wife:  Sounds great!  What do you have in mind?

Me:  Well, I was thinking of taking you out and buying you the biggest omelet in the city. Three, four, maybe even five eggs.

My wife:  Really?  Are you sure we can afford it?

Me:  We’ll find the money.  And besides, I’ve been putting a few bucks aside every week for the past three months just for this.

My wife [eyes filling with tears]:  Oh, my dear, dear husband.  Do you love me that much?

Me:  Yes.  Yes, I do. 

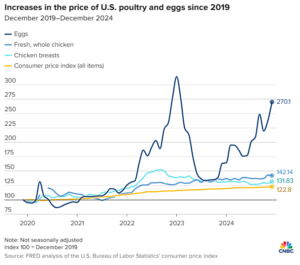
That scene isn’t as far-fetched as it sounds.  Eggs are one of the protein staples of the modern diet, with Americans eating about 23 dozen eggs each year. They have soared in price as a nasty strain of avian flu has led to the death of millions of hen layers and other birds across the United States and the rest of the world.

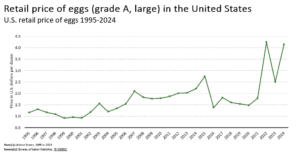
The most pernicious form of avian flu, known as H5N1, is devastating to affected birds.  Mortality rates can be as high as 90-100 percent. Even milder forms of the flu can lead to significantly reduced egg production. And with lower yields come reduced supplies and higher prices – per-dozen egg prices now at an average of $4.95…and anticipated to climb 20 percent higher as we move further into 2025.

As noted by www.moneynotmoney.com:

The absolute price of eggs has increased by $1.54 (80.63%) in the last decade, and $2.61 (310.71%) since 1980.

Even when adjusting prices for inflation, egg prices are still higher than they were in 1980. And not just a bit more expensive, we are talking about a significant increase no matter how you look at it!”

How widespread is avian flu?

A form of avian flu, called highly pathogenic avian influenza (HPAI), was noted by USDA’s Animal and Plant Health Inspection Service (APHIS) as far back as February 2022.  This particular H5N1 strain was first noted on March 25, 2024, and has been growing ever since.

Last December, USDA said that since 2022 the bird flu had been detected in more than 125 million birds across 569 counties in all 50 U.S. states, in both commercial and private facilities.

On January 23 of this year, USDA further noted that an additional 98 flocks had been infected in the past month alone, with another 15 million birds affected.

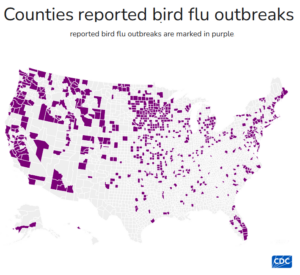
Data from the Centers for Disease Control (CDC) also point to the enormous effect of the disease – citing 1,572 reported outbreaks across 641 counties, with 159,307,978 affected in poultry flocks and aquatic birds.

The United Nations says the bird flu has caused the deaths of more than 300 million birds worldwide – involving not just laying chickens but ducks, geese and other kinds of birds as well.

Why are egg layers more at risk than broiler chickens?

The avian flu virus can afflict both egg layers (hens that lay eggs) and broilers (chicken produced for your dinner plate) produced for meat.  But so far, the disease has been most damaging to layers, since they live for much longer: a healthy laying hen will start to produce eggs at around 18 weeks old and, on average, five-to-six more years following.

USDA reported in January that avian flu HPAI has been detected in commercial broiler flocks in three states – Georgia, Maryland and Virginia.

Broilers also face rigorous testing by APHIS before they leave any farm and additional testing when processed.

The damage to broiler flocks so far has been small enough that supplies closely match demand – meaning minimal price effects. Broiler meat prices are up only about 1 percent from a year ago.

Avian flu’s migration beyond birds

To add to the complicated picture, the virus also can affect other animals.

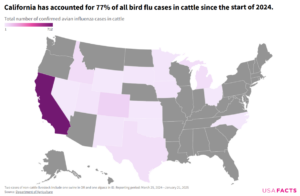
Infection among 929 dairy cattle has been reported across 16 states, with more than three-quarters in California. Isolated and small numbers of infections have also been reported in cats, pigs and even an alpaca.

By any measure, it’s a devastating disease, with resulting concerns about not just the cost of eggs but also the risk to humans and other mammalian species.

Scientific American notes that CDC reports that 67 human cases of H5N1 have been confirmed, most involving mild symptoms. (One case involving the death of a patient with underlying health issues has been recorded in Louisiana.)

CDC notes that such cases involve direct contact between the human and an infected animal, including cows. Cows pass large amounts of the virus in their milk, but pasteurization has been shown to kill the virus.

Is it safe for us to consume eggs right now? Fear not.

As Good Housekeeping reported: “The risk of getting the H5N1 bird flu virus from eggs is minimal to none, and safe storage and cooking of eggs reduces any potential risk,” says Geeta Sood, M.D., ScM, assistant professor of medicine in the Johns Hopkins Medicine Division of Infectious Diseases at Johns Hopkins University in Washington, DC.

What does all this mean for egg prices?

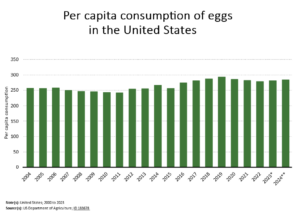
We eat a lot of eggs. USDA’s Economic Research Service (ERS) notes that per-capita egg consumption in the United States averaged 284 eggs in 2024.  Before the pandemic, the numbers were even higher – in the range of 294.

Swings in egg prices are nothing new.  But the most recent increases have been abnormally high, at a time when high food inflation has been a hot topic among consumers and politicians.

Both Joe Biden and now Donald Trump have made control of food price inflation a major goal. The devastating loss of layers – and the significant costs of decontamination, implementing stringent new safety precautions against disease and rebuilding flocks – are adding to the economic pressures facing producers across our food chain.

That’s a Lot of Eggs…

U.S. table egg production totaled 92.6 billion in 2022, a 3 percent decrease from 2021.  The U.S. had 308 million commercial laying hens at the end of 2022, down 4.5 percent from 2021. The daily rate of lay averaged 82 eggs per 100 layers in 2022. On average, each laying hen produces 300 eggs per year.

Meanwhile at the grocery store…

The Bureau of Labor Statistics (BLS) reports that average egg prices in January increased a whopping 19.5 percent from December, rising to an average of $4.95. “This was the largest increase in the eggs index since June 2015 and it accounted for about two thirds of the total monthly food at home increase (in food inflation),” according to BLS.

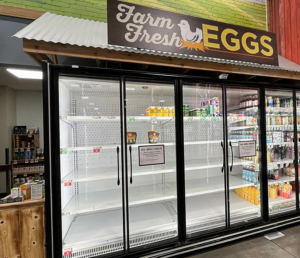
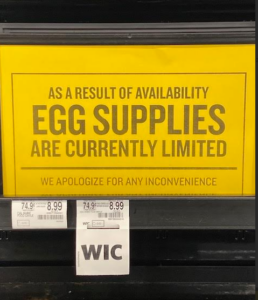
A local supermarket worker described the retail situation in simple terms: “Eggs come in on Friday’s truck.  By Monday, they are pretty much gone.”

But buying that dozen eggs at the supermarket is only one way the avian flu is contributing to higher food costs.

Eggs are a key ingredient in many prepared foods and an extremely popular food eaten in restaurants, diners and other out-of-the-home dining. Higher egg prices inevitably are passed along in all these venues, adding to the poor consumer’s economic woes.

What’s being done about it?

Avian flu has generated extensive interest from farm to consumer, with a variety of responses.

Layer producers deal with the threat of avian flu with a carefully tiered series of steps worked out with federal and state authorities.  When the avian flu is detected, the first step is to quarantine the flock and any equipment that may be around the birds. The flock is then humanely euthanized.

The farm where diseased birds were found is thoroughly disinfected, and the entire farm tested for 21 days to confirm that it is free of the disease. The surrounding area also is monitored and tested for the disease.

The farm community has aggressively sought to get ahead of the disease with extensive prophylactic actions, careful monitoring and testing, and even the personally painful and economically difficult decision to eradicate entire flocks.

Media and industry communications also have sought to raise public understanding of the complex issue and the steps being taken to assure a safe food, in order to avoid over-reaction.

Scientists in various government agencies and the private sector continue to work on understanding the disease and effective methods to combat it. Some of the most aggressive efforts have been focused on development of an effective vaccine against avian flu. That’s not a new idea. But it’s proven to be less straight-forward than it might seem on the surface.

Various avian flu vaccines have been developed since the first avian flu outbreaks in Southeast Asia in 2001-02 and have been used in countries around the world, with mixed success.  For example, China and Egypt have used vaccines against the disease, although recurrent outbreaks still happen.

Research in the United States also has produced encouraging results, with one HPAI vaccine produced by Zoetis in February received conditional approval from USDA’s Center for Veterinary Biologics (CVB).

H5N1 & trade implications

But the widespread use of vaccines against the avian flu remains a highly contentious issue. The major reason: use of vaccines could trigger import restrictions for poultry among foreign customers.

Existing and long-standing trade agreements contain stringent requirements for what can and cannot be present in imported foods. Such requirements have been actively used around the world both as a food-safety precaution – and frankly, as a means of protecting national industries.

U.S. agriculture knows this phenomenon all too well.  Poultry industry leaders and politicians have been wary of rushing to vaccines, preferring to emphasize prophylactic measures instead.

Poultry is the most-consumed livestock product in the world.

The United States is the world’s largest producer and second-largest exporter of poultry meat. According to USDA data, U.S. broiler exports over the past decade have averaged 7.1 billion pounds per year. USDA’s Foreign Agricultural Service (FAS) estimates the three-year average of poultry meat and products at $5.66 billion.

Egg exports, including both shell eggs and egg products, last year exceeded 234 million dozen. The three-year average of egg and egg-product exports from the United States is $741 million.  Farmers today need the income that comes from poultry and egg trade.

Statista notes that the United States imports about 15 million dozen eggs each year, compared to exports of almost 16 times that amount – and more compared to some other market analysis. Part of the disparity can be traced to simple matters of handling and consumer reaction. In the United States, eggs are carefully cleaned and refrigerated, while most of the rest of the world prefers to leave eggs unrefrigerated.

How long will this go on?

One of the oldest adages in economics (and especially the agricultural world) reads: “the cure for high prices is high prices.”

Egg prices are most likely to moderate when the layer industry has had time to adapt to an extraordinary set of challenges. New facilities must be built and existing ones cleaned, sanitized and modernized with the latest and best sanitary equipment.

Aggressive and where possible better disease control practices must be implemented.  High egg prices perversely provide the economic incentives to prompt all those actions.

There also is the issue of the time needed to rebuild flocks.  Replacing lost layers will proceed when the remedial protective actions have been completed.  It makes no sense to invest in more animals if the proper precautions have not been taken. And once they are replaced, it will take months for the new birds to begin producing eggs.

Red food dye: Toxic or tame?

Click Play to listen to our generated podcast. Click on links for transcript and our full podcast library


Announced on January 15, 2025, this ruling comes after decades of debate and advocacy, highlighting the complex interplay between scientific evidence, regulatory processes, and public opinion on health concerns.

Red Dye No.3, your days are numbered ...This decision is based on the Delaney Clause, a portion of the law from in the 1950s, which requires the FDA to ban any additive found to cause cancer in animals and humans. This is regardless of the relevance to human health at typical exposure levels.

However, some experts say the laws must evolve with current studies on the subject matter, which are more accurate than those conducted in the ’50s, when the law served mostly as a “catchall” for food safety.

But how much is really too much when it comes to human health?

Studies on Red Dye Toxicity

While we know too much of any one thing is bad for us, this development has sparked discussions about the scientific thresholds for determining food additive safety, the timeline for implementing such bans, and the broader implications for food manufacturers and consumers alike.

Several studies have shown the potential toxicity of red dyes, particularly Red Dye No. 3. Here’s an overview of the key findings and regulatory actions:

  • Cancer in Lab Animals: Studies conducted over 30 years ago found that Red Dye No. 3 caused cancer in male rats when administered at high doses. This was the primary basis for regulatory action.
  • DNA Damage: A 2001 study published in Toxicological Sciences showed that Red Dye No. 40 (Allura Red) induced DNA damage in mice, particularly in their colon epithelium cells.
  • Recent Research: A 2023 study in mice indicated that Red Dye No. 40 might cause DNA damage and affect the microbiome, potentially contributing to colonic inflammation.

As you can see from the above-noted studies, research on red dye toxicity has primarily focused on animal models, with thresholds for damage in humans remaining unknown.

Scientific Thresholds and Human Cancer Risk

In 1969, Red Dye No. 3 was approved for use in food and ingested drugs. FDA declined to permit Red Dye No. 3 for use in cosmetics and topical drugs in 1990 based on the aforementioned studies showing cancer development in male rats exposed to high levels of the dye. The FDA’s 1990 decision did not revoke the approval for food and ingested drugs.

However, there is no evidence that  Red Dye No. 3 causes cancer in humans. 

According to Market Watch and their interview with Scott Keatley, a registered dietitian and co-owner of Keatley Medical Nutrition Therapy, a practice in New York City:

Keatley found that for a 50-pound child, that would equate to 12 red gummy bears, or 6 pieces of red licorice, or half a cup of red gelatin dessert EVERY day

For a 150-pound adult, the math would work out to triple those amounts — or about 36 red gummy bears per day…that’s a lot of candy. 

Furthermore, the FDA has stated in their press release on the ban that the mechanism by which Red Dye No. 3 causes cancer in male rats “does not occur in humans…studies in other animals and in humans did not show these effects”.

The FDA also maintains that “claims that the use of FD&C Red No. 3 in food and in ingested drugs puts people at risk are not supported by the available scientific information”.

While we know the evidence for human cancer risk is inconclusive, the Delaney Clause meant that the FDA was required to take action against Red Dye No. 3.

Research on other synthetic food dyes, particularly Red Dye No. 40, is ongoing, with some studies suggesting potential health concerns that warrant further investigation.

Will this be a domino effect?

While no immediate bans have been announced, there are indications that other additives might face similar scrutiny in the near future. Watchdog groups are already calling attention to other potentially harmful additives. A health watchdog has warned about three other food additives linked to cancer following the Red Dye No. 3 ban.

The FDA’s decision to act on Red Dye No. 3 after decades of inaction may signal a shift towards more proactive regulation of food additives.

Consumer advocacy groups, emboldened by the success with Red Dye No. 3, may increase pressure on the FDA to review other controversial additives. For example, the Center for Science in the Public Interest (CSPI), which petitioned for the Red Dye No. 3 ban, may target other additives.

This ban aligns the U.S. more closely with regulations in the European Union, which previously banned Red Dye No. 8, except for cocktail cherries, cosmetics, pharmaceuticals and toothpaste. Additional regulations exist in Australia and New Zealand, where many additives are already restricted. This international context may influence future FDA decisions on other additives.

While it’s uncertain which specific additives might be banned next (e.g., Red Dye No. 40), the Red Dye No. 3 decision has likely opened the door for increased scrutiny of food additives with longstanding safety concerns or those already restricted in other countries.

The food industry and consumers should be prepared for potential changes in the coming years as the FDA and advocacy groups continue to evaluate the safety of various food additives.

How will this ban impact food manufacturers?

Many food manufacturers are already exploring alternative natural color additives without impacting the flavor.

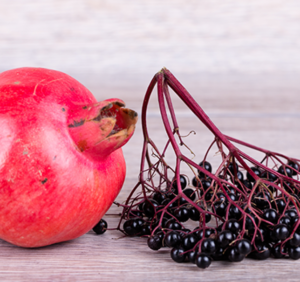
There are many substitutes for Red Dye No. 3, such as beet juice, purple sweet potato extract, red cabbage extract, carmine, and pomegranate juice. These natural substitutes align with growing consumer preferences for clean-label ingredients. After all, many of us would rather consume pomegranate juice in Jell-o than red dye.

The state of California has already passed its own ban of Red Dye No. 3 that goes into effective January 1, 2027, so many companies are already preparing for this transition. But we are contending with a lot of items: approximately 3,000 items sold in the United States include Red Dye No. 3, such as baked good, candies, and strawberry meal replacement shakes.

Food manufacturers have until January 15, 2027, to reformulate their products, while drugmakers have until January 2028. Some manufacturers may wait closer to the deadline to implement these new ingredients into their production lines due to higher short-term costs.

Why is this issue the FDA’s focal point right now?

Here’s the deal: we know red dye is simply a color additive in food, is not a preservative or flavor mechanism and is not necessary for food products. We also know that we are not going to give our children 12 red gummy bears every day.

The real nutritional concern should be excess sugar, insufficient protein, and a diet high in sodium. Are children getting their daily requirement of fruits, vegetables, and fiber? A more relevant question for the FDA is: How can we help our nutritionally-deficient children have healthy diets?

Ultimately, the current push to ban red dye is as much about legal regulations as it is about nutrition. While there is no evidence to suggest that red dye causes cancer in humans, the FDA is required to follow the Delaney Clause.

How Will Tariffs Affect Overseas Trade?

Click Play to listen to our generated podcast. Click on links for transcript and our full podcast library


As we dive into the complex world of ocean freight’s role in U.S. food imports and exports, it’s clear that the agricultural trade and transport landscape is facing some pretty choppy waters ahead.

The Current State of U.S. Agricultural Trade

Before we delve into the potential impacts of new tariffs on ocean transport, let’s take a snapshot of where U.S. agricultural trade stands today.

According to the latest data from the U.S. Department of Agriculture’s Economic Research Service (USDA ERS), U.S. agricultural exports for fiscal year 2025 are forecasted at a whopping $170 billion.

That’s a lot of soybeans, corn, and beef making their way to dinner tables around the world.

On the flip side, we’re also bringing in quite a feast from abroad. U.S. agricultural imports for the same period are projected to reach $212 billion.

From avocados to wine, our taste for international flavors continues to grow, leading to the largest trade deficit seen in over 65 years.

As an FYI, Garland’s recent post, Tariffs: Economic Boost or Negotiating Tool? does a great job exploring tariffs and their economic and political implications — we highly recommend the read.

The Ocean Freight Connection

Now, you might be wondering, how do all these agricultural products travel around the globe? The answer is primarily by sea. Ocean freight plays a crucial role in the movement of agricultural goods, both in and out of the United States.

Exports

If you’re surprised by this, you have good reason: while container shipments only account for a quarter of U.S. agricultural exports by volume, they represent over half of the value of our total exports. That’s a lot of high-value goods sailing the seven seas. The destinations receiving the bulk of these goods are China, Canada, and Mexico.

The busiest port in the U.S., the New Orleans Port Region, moves almost 40% of all U.S. waterborne ag exports alone.

Most of these exports were bulk grains and products, like corn, soybeans, animal feed, and rice. Other significant exports from this port include soybean and corn oils and frozen poultry.

But Gulf ports like New Orleans don’t just export ag products.

In fact, the value of ag exports is a small portion of the total value of all goods. Because of the relative proximity of products to Mississippi River, these Gulf ports constantly crank out enormous amounts of oil and gas, chemicals, and ores, providing a cost-efficient transport corridor. Houston and New Orleans alone account for about 65% of total U.S. oil and petroleum exports.

Imports

The European Union and Mexico are the second and third largest countries in terms of agricultural imports into the U.S. Products received from these partners are mostly comprised of tropical fruits, sugar, soybeans, and packaged grocery and beverage items.

New York and Philadelphia rank highest on the receiving end for 2023, accounting for 17% and 7% of imported goods, respectively.

Trump’s Tariff Proposal: A New Trade Storm Brewing?

Now, here’s where things get interesting.

President Trump plans to impose 25% tariffs on Mexico and Canada set to take effect in March 2025, postponed from February 1. This ongoing negotiation has the attention of food producers, as Mexico has become one of our largest trading partners and increasingly important export markets for U.S. farmers in recent years, with most goods traveling overseas.

Trump has also directed federal agencies to review trade pacts with China. This has many farmers recalling Trump’s first term in office. As a result of retaliatory tariffs from the onset in summer 2018 through the end of 2019, the USDA ERS reported that U.S. agricultural export losses exceeded $27 billion, with soy and pork producers hit particularly hard.

China’s swift retaliation accounted for about 95% of the value lost, but our losses were significantly mitigated by an outstanding trade agreement with China to purchase U.S. soybeans, leaving many questioning how losses might affect us next time around.

Potential Outcomes on U.S. Ag Trade

In what ways could these tariffs affect U.S. farmers and exporters? A number of things could happen that disrupt our current flow of goods, both incoming and outgoing. And these factors affect one another, leading to thorny diplomatic situations with various scenarios to navigate.

Let’s break down these potential situations:

  • Reduced Competitiveness: New tariffs could make U.S. exports less competitive on the global stage. This could open the door for competitors like Brazil to gain more market share, particularly in soybean exports.
  • Retaliation Risks: If history is any guide, we might see retaliatory tariffs from affected countries. During the 2018-2020 U.S.-China trade war, U.S. soybean exports to China plummeted from $14 billion in 2016 to just $3 billion in 2018 – a staggering 78% decrease.
  • Market Disruptions: The tariffs could disrupt established trade flows. For instance, Mexico is a major supplier of fresh fruits and vegetables to the U.S.
  • Price Fluctuations: Tariffs could lead to price increases for a wide variety of food and beverage products, affecting both consumers and the food industry.
  • Potential Export Losses: During the previous trade war, U.S. agricultural producers faced approximately $27 billion in lost exports between 2018 and 2019, with soy and pork producers hit particularly hard.

For more information on these scenarios, refer to our article, Tariffs: Economic Boost or Negotiating Tool?

Freight Impacts from Trade Tensions

Now, let’s consider how these potential tariffs might affect ocean freight costs. It’s a bit like predicting the weather – there are many factors at play, but we can make some educated guesses based on past experiences and current trends.

  • Demand Fluctuations: If tariffs lead to reduced trade volumes, we might see a decrease in demand for shipping services. This could potentially lead to lower freight rates in the short term.
  • Route Changes: Tariffs might cause shifts in trade routes as countries seek new markets or suppliers. This could impact shipping patterns and potentially affect freight rates on certain routes.
  • Uncertainty Premium: The uncertainty created by trade tensions and changing policies could lead to volatility in freight rates as shipping companies try to navigate the new landscape.
  • Capacity Adjustments: If trade volumes decrease significantly, shipping companies might reduce capacity by idling ships or slowing vessel speeds. This could eventually lead to higher freight rates as supply adjusts to demand.

The Bigger Picture: Beyond Tariffs

While tariffs are grabbing headlines, it’s important to remember that they’re just one piece of the complex puzzle that is international trade.

Several factors beyond tariffs can significantly influence U.S. agricultural exports and ocean freight costs.

Of course, there are the immediate costs of maintaining these ships and its transport across the world. Operators of these vessels must contend with the ever-changing costs of fuel, accounting for about 40% of total costs. Insurance and labor also factor in, but the fees associated with port and custom fees also command a significant chunk of its operations.

External factors out of the operator’s control make the industry far murkier. The overall health of the global economy plays a crucial role in determining the demand for U.S. agricultural products. And this is largely driven by the supply and demand cycle of the industry —  a constant balancing act between volume of goods and ocean freight capacity. Add in the effects of unpredictable weather patterns and crop yields, and you’ve got the perfect conditions for volatile capacity constraints.

Additionally, fluctuations in the value of the U.S. dollar can impact the competitiveness of U.S. exports in international markets. And the ever-changing landscape of environmental standards for shipping can also have implications for freight costs in the coming years, as the industry adapts to more sustainable practices and technological innovations.

But timing is everything when it comes to the ocean freight market. Because of these variables, operators will often book freight far in advance as an economic hedge for rising costs. This means the shorter-term factors cited above are a bit secondary to the market’s perception of overall economic drivers.

Looking Ahead: Navigating Choppy Waters

As we look to the future, it’s clear that U.S. farmers and exporters may need to brace for some chop ahead. The potential implementation of new tariffs could reshape the landscape of agricultural trade, impacting everything from commodity prices to shipping routes.

However, it’s not all doom and gloom. The resilience and adaptability of the U.S. agricultural sector have been tested before, and farmers have shown remarkable ability to weather economic storms. Moreover, the increasing global demand for food provides a strong foundation for U.S. agricultural exports in the long term.

And it’s important to note that tariffs can be used as a negotiation tool, as well as instigating action from our trading partners. Should Canada and Mexico curtail illegal immigrants coming across the U.S. border, tariffs would be expected to dissipate. We would also expect a similar change to tariffs with China, should fentanyl and other dangerous substances cease to enter the U.S.

As consumers, we might see some changes in the prices and availability of certain products, particularly those that rely heavily on imports or exports affected by the tariffs. However, the diverse and robust nature of the U.S. food system should help mitigate major disruptions.

Can a Small Food Label be a Big Deal?

Click Play to listen to our generated podcast. Click on links for transcript and our full podcast library


Imagine strolling down the supermarket aisle, your eyes drawn to a small, simple, black-and-white box on the front of food packages. This isn’t just another marketing gimmick – it’s the FDA’s latest weapon in the battle against chronic diseases.

The proposed “Nutrition Info box” is set to transform how Americans shop for food, offering a quick “Low,” “Med,” or “High” snapshot of saturated fat, sodium, and added sugars content. And it has been a long time coming.

A nutritional revolution on your grocery shelves

Slated for potential implementation between 2029-2030, front-of-package (FOP) label regulations will fundamentally transform how consumers interact with food packaging, potentially impacting food manufacturers’ reformulation strategies and market positioning.

Driven by the alarming prevalence of chronic diseases and escalating healthcare costs, the FDA’s initiative goes beyond mere labeling—it’s a strategic intervention aimed at empowering consumers to make more informed dietary choices.

While the EU and Chile have been using a colorful traffic light system, the FDA is taking a more subtle approach. The proposed design aims to provide clear information without the potential alarm of red warning signs. It’s like comparing a minimalist art piece to a vibrant street mural – both eye-catching, but with different emotional impacts.

Why now? The chronic disease crisis

With 60% of Americans battling at least one chronic disease and healthcare costs soaring to $4.5 trillion annually, the FDA is pulling out all the stops. This label isn’t just about information – it’s a public health intervention disguised as packaging design. As FDA Commissioner Robert M. Califf puts it, “It is time we make it easier for consumers to glance, grab and go”.

This labeling revolution could spark a domino effect in the food industry. Manufacturers might scramble to reformulate products, turning the supermarket into a battlefield of nutritional one-upmanship. It’s like giving consumers X-ray vision for nutrition, potentially transforming the food landscape one package at a time.

In the end, this small label could be the catalyst for a healthier America, proving that sometimes, the biggest changes come in the smallest packages.

When will we see these in effect?

The FDA’s proposed rule on FOP nutrition labeling is currently open for public comments until May 16, 2025. After this period, the FDA will review the comments and potentially make revisions before issuing a final rule, which can take several years. Once finalized, large companies with $10MM+ in food sales have 3 years to implement; small companies have 4 years.

The FOP labeling requirement will impact most food manufacturers producing packaged foods that currently bear a Nutrition Facts label.

However, there are some exemptions, including:

  • Foods in packages with a total surface area of less than 12 square inches
  • Packages marketed as gifts containing a variety or assortment of foods
  • Unit containers in multiunit retail food packages

Assuming the rule is finalized without significant delays, consumers might start seeing the new FOP labels on shelves as early as 2029 for products from large manufacturers, and 2030 for products from smaller companies. However, this timeline could vary depending on the duration of the FDA’s review process and any potential challenges to the rule.

What are the economic impacts to the food industry?

Here are some of the potential economic impacts on the food industry:

  • Reformulation Costs: Many food manufacturers are likely to reformulate their products to meet new “healthy” criteria. This could lead to substantial upfront research and development expenses until economies of scale are achieved
  • Price Changes: There’s evidence of a 5.5% increase in prices of unlabeled products relative to labeled ones due to regulations. This suggests that companies may adjust pricing strategies to offset costs or capitalize on perceived healthier options.
  • Demand Shifts: Products receiving labels, especially those previously perceived as healthy, could experience up to a 40% decrease in demand. This may lead to revenue losses for some manufacturers and gains for others producing healthier alternatives.
  • Compliance Costs: The industry will face expenses related to implementing new labeling requirements, including design changes and printing costs.
  • Potential Cost Savings for U.S.: Despite initial costs, the regulations could lead to long-term healthcare and societal cost savings. The US calorie menu labeling law alone is estimated to result in net lifetime savings of $10.42 billion from a healthcare perspective and $12.71 billion from a societal perspective.
  • Market Differentiation: Some companies may benefit from increased product differentiation, potentially allowing for premium pricing of healthier options.
  • Industry-wide Impact: Experts estimate that food fraud, which stricter labeling aims to combat, affects 1% of the global food industry at a cost of about $10-$15 billion annually. New regulations could help reduce these losses.

Overall, while there are significant upfront costs for the food industry, the long-term economic impacts could be positive, especially when considering broader societal benefits and potential market opportunities for healthier products.

How does this new label compare to other countries?

The new FOP labeling regulations differ from those implemented in other countries in several key aspects:

Comparison with European Union (EU)

  • Approach: The US proposes a black-and-white design, while the EU uses a colorful traffic light system.
  • Additive labeling: The EU assigns E-numbers to additives, while the US requires full names on labels.
  • Nutrient disclosure: US labels tend to provide more detailed nutrient information compared to EU labels.

Comparison with Chile and Americas

  • Stringency: The proposed US regulations are less stringent compared to Chile’s and the Pan American Health Organization’s (PAHO) criteria.
  • Coverage: Under current proposals, 54.4% of packaged products in the US would require FOP labels, compared to 68.4% in Chile and 81.3% under PAHO criteria.
  • Ultra-processed products (UPPs): The US criteria would allow 33.4% of UPPs to avoid FOP labeling, compared to 18.4% in Chile and only 2.3% under PAHO standards.

Global Trends

  • Adoption: Over 40 countries have implemented easy-to-understand FOP nutrition labeling systems. This has led to reduced consumer dietary intake of selected labelled nutrients.
  • Variety: Different countries use various systems, such as “excess sugar” stop signs in Mexico, the Nutri-Score system in France, and Health Star Ratings in New Zealand.

While the US is moving towards more transparent FOP labeling, its proposed regulations appear to be less stringent than those in some other countries, particularly in identifying ultra-processed products. The approach differs from the EU’s color-coded system and the more comprehensive labeling requirements seen in countries like Chile.